 Today I had art class where our art teacher showed us some different ways to get inspiration for our art component for our exhibition. Today we had to make a mind map to start and brainstorm ideas for our art component. What we had to write down was: What we want people to... -See -Imagine -Feel -Remember That’s what we did for art class today. For maths we did more things about ways to present data. We specifically used the frequency table, bar graphs and the dot plot. Our homeroom teacher asked the primary teachers their height and told us to make a frequency table, dot plot and bar graph with that data. I feel like a did a good job because I presented the data very clearly and I think overall it was very neat and tidy. This piece of knowledge will help me when I collect data for my survey for exhibition. In the afternoon I continued to work on my infographic. I can definetly see it coming together. I’ve added some little clipart pictures to make it a lot more colorful and overall enhances the entire infographic and will be a little bit more interesting for the younger readers. So that’s what I did today!
6 Comments
Today I started the day with my homeroom teacher giving a lesson about interviewing someone. So I watched a few videos about it and I did learn a few things about it. I learned that you should start by introducing yourself, listen to what they have to say and always end with a thank you. This morning I also scheduled my weekly student teacher conferences. I scheduled it on Thursday at 9:00. Today I started to do my rough draft for my mathematics component. I went to the Canva website and started to make my infographic. So far I’ve already put down some information but not all yet. I’ve already had a thought on what my infographic will look like so that’s something I will be doing this entire week. One video I found today was this TED talk about people’s access to electricity in Africa. I liked it because it does clearly state the problem and what the impacts of it are. I also like it because it’s very informative and it gives a lot of information about my topic. 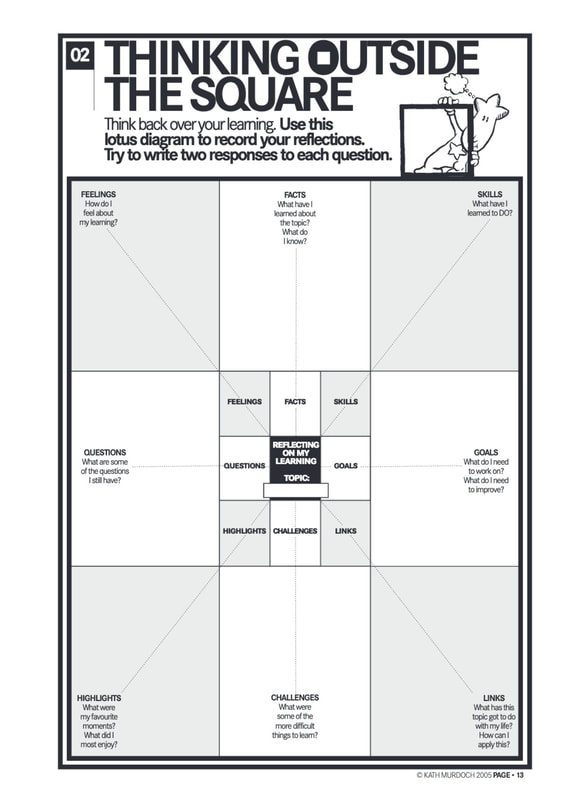 Reflecting about my learning:
Going into exhibition I didn’t know that I could such wide array of knowledge about my topic. Some facts that I learned are: -Renewable energy doesn’t always mean sustainable energy. -Non-renewable energy could mean sustainable energy. -Oil spills can have a large impact on the environment. -Some experts are turning waste toilet paper into energy. -Biomass is considered both renewable and non-renewable energy. I’ve learned how to: -Easily make surveys digitally. -Make a full on blog. -Cite sources. -Organize my notes. I feel very proud and happy about my learning and I think that this topic will often come into use. I think that this topic comes into my life a lot because non-renewable energy sources are the most commonly used energy sources. Non-renewable energy sources are the source of air pollution, global warming, loss of natural habitats and many more. If all these problems don’t stop soon the world will be in ultimate danger. My favorite part of the exhibition journey up until now is creating my blog because I think it was very interesting and I guess it’s kinda cool knowing that you’ve made a blog before. Some challenges I faced or am facing is finding a primary source, finding sources for my second line of inquiry and citing a few sources. Some questions I still have are: -Are the government officials actually taking action against this issue. -Are all these plans about increasing our use of renewable and sustainable energy sources actually going to happen? Also be sure to checkout some of my lines of inquiry pages! Today I had my weekly student teacher conference with my homeroom teacher. We obviously didn't do it face to face so we did via video chat. We talked about what I've sort of been doing and what do I need help with. So I said I needed help looking for more sources to research about my second line of inquiry. If you've checked that out it's kind of obvious that I comparing to other lines of inquiry pages. Another thing is that I don't know how should I get information from a primary resource. so me and my homeroom teacher said that I should make a survey. So that's what I did from the end of the morning and in the afternoon. So for my math component I'm going to do an infographic. So I found this app/website called Canva that ca make posters, cards, infographics, etc. so unless my teacher found another website I will probably use that one. So other than that I just did research so that's about it.  Since today was the first day of Virtual School I’m also going to be writing about that because it’s something special and technically it’s has something to do with exhibition. So a special thing about this is that we have the flexibility to choose what we want to do. For example in the schedule I might say maths in the morning and exhibition research in the afternoon but you’re allowed to switch thing up. Another thing is that you have to be independent and you must manage your time well, because in class you have teachers to tell you if it’s the end of snack time or when we have to finish our work and that’s something don’t exactly have at home. So the first thing I did today was about blogging. I saw the lesson from our teacher about blogging in seesaw and I watched it and she said that we should comment on at least 2 different people’s blogs. She also said that we have to respond to the comments on your own blog posts. So that’s what I did for about one period. After that I looked through my week 4 checklist and did the things I haven’t done yet. So today I added my research about the lines of inquiry in my knowledge page so you can check that out. I also added a lot more citations on my bibliography page. So now you can see a lot more stuff on my knowledge and bibliography page. I think that I’m pretty happy on what I did today. For art class our art teacher showed us some different pieces of artwork about global issues as an inspiration for my art piece for exhibition. She gave us a task which was to search up some pieces of artwork about our exhibition topic. For our Bahasa Indonesia class our teacher posted 2 posters and asked us to share our thinking about those two different posters. And of course it had to be in Indonesian not English. For maths there were 2 videos about open sentences and true and false equations. We were given the task to write 10 of our own true and 10 of our own false equations. We also had to write 10 open sentences but not with the answers because someone else will have to answer those open questions. I also had to answer someone else’s open questions. Lastly, for swimming class our teachers combined swimming with PE so our swimming and PE classes will be pretty much workout classes. Today I did 40 minutes of workouts and I think I did a pretty good amount of exercise comparing to the other subjects where I had to sit in front of my Ipad and do work. So far I am liking on how this virtual school thing is working out and I think it’s a good way to study at home. 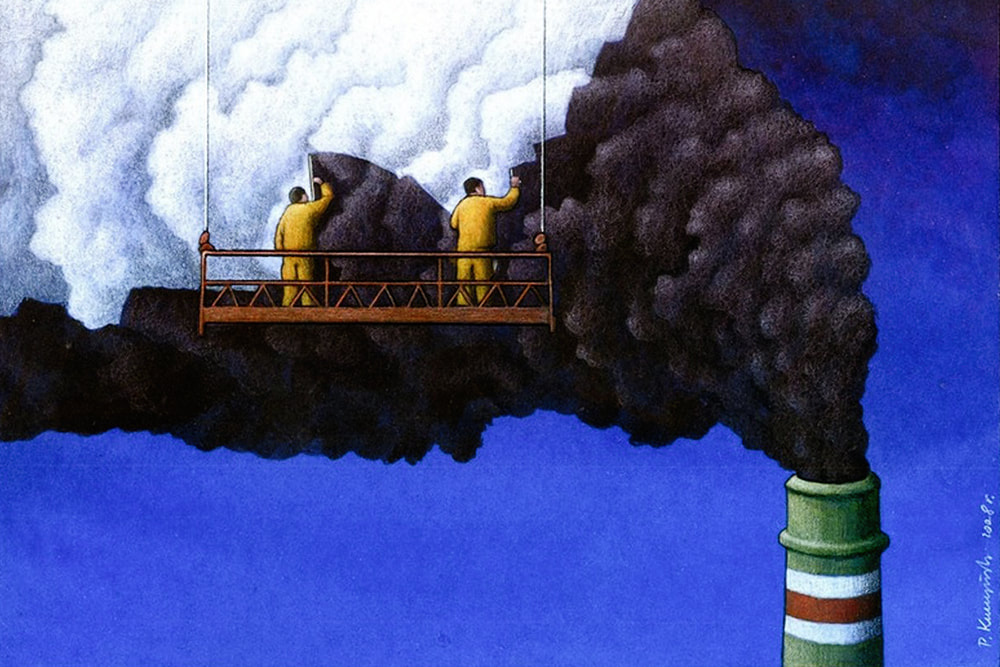 https://www.google.co.id/url?sa=i&url=https%3A%2F%2Flirfons.com%2Fdiary%2Fpawel-kuczynski-life-between-the-lines&psig=AOvVaw1RyJ21A-noASVmSTPJ_pHf&ust=1583394344710000&source=images&cd=vfe&ved=0CAMQjB1qFwo TCLD3k96pgOgCFQAAAAAdAAAAABAN So for 2 weeks starting from today we can’t go to school so we’re going to start doing “virtual learning” tomorrow. So we will be doing all our normal things that we do in school but the difference is that it’s at home but we won’t be doing things like art and swimming and those subjects that are a little harder to do at home. Today I did my research at home. I found the Netflix documentary called “Inside Bill’s Brain: Decoding Bill Gates” that my mentor suggested to me. I started watching it but I didn’t finish it because there was a problem with the internet. So some things I saw was: -Bill Gates left Microsoft in 2008. -He started the Bill Gates Foundation with his wife Melinda. -He does not have a good driving record... -He’s focusing on clean water and sanitation for underprivileged people. I think that he is starting to think about making a big difference in the world and that’s what this exhibition is all about. Yesterday I was also testing out a website that can make infographics. I just started to play around with the website just so I know how it would work. Today we got our e-mail for Microsoft outlook/teams so we can easily send e-mails to our mentors. I noticed that the website is different in Google Chrome and Safari so I’m using it in Safari. Since our rough draft for our mathematics component is due in 1 week so we discussed some ways we can do our maths component. I think that I would like to make an infographic because I think that they’re very interesting and it also counts as my tech piece. Today our teacher showed us a website called Survey Monkey that can easily give you sort of like a template of your survey and it can also make a graph for you, it also automatically can collect your information. Click here to check out my test try on Survey Monkey. Other than that I continued my research and I’m well aware that next week is the last week of my research so I have to start to finalize my research.  |
Archives
April 2020
Categories |
 RSS Feed
